AUD/USD TECHNICAL ANALYSIS
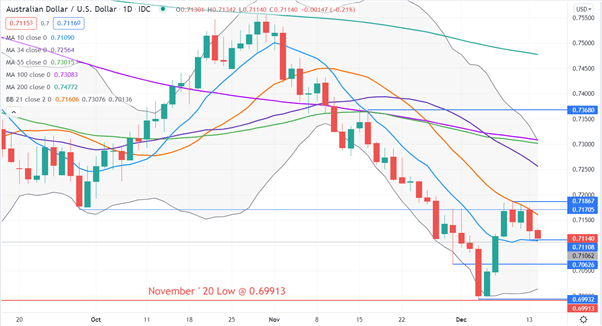
AUD/USD accelerated toward the November low of 0.69913, but the move was rejected. That tick down saw a close below the lower band of the 21-day simple moving average (SMA) based Bollinger Band. The next day saw a close above that lower band, which then saw a rally unfold.
From there, AUD/USD appears to have established a short-term range between the recent low and high of 0.71108 and 0.71867 respectively.
The low of 0.71108 also coincides with the 10-day SMA which could provide support.
Looking at the SMAs, a bearish triple moving average (TMA) formation requires the price to be below the short term SMA, the latter to be below the medium term SMA and the medium term SMA to be below the long term SMA. All SMAs also need to have a negative gradient.
All the SMAs have a negative gradient, including the 10-day SMA. However, the 10-day SMA is below the price. This might suggest a pause in bearishness. Should the price fall below the 10-day SMA, it could trigger bearish momentum to unfold.
Excluding the 10-day SMA, any 3 other SMAs would meet the criteria for a bearish TMA.
Below 0.71108, support may lie at the pivot point of 0.70626 or prior lows of 0.69932 and 0.69913.
Above 0.71867, resistance on the topside might be at the 34, 55 and 100-day SMAs or the previous high of 0.73680.


